Dogecoin (DOGE) Sees Spike in Demand for Short Positions
Leading meme coin Dogecoin (DOGE) has witnessed a double-digit price decline in the last week.
The decline intensified on June 17, when DOGE plunged to a three-month low, triggering a surge in long liquidations – the highest this year.
Dogecoin Short Traders Pay Funding Fee
On June 17, Dogecoin’s price cratered to a three-month low of $0.12. This resulted in a rise in long liquidations, amounting to $44.21 million on that day. This marked the highest figure since the year began.

In an asset’s derivatives market, liquidations occur when a trader’s position is forcefully closed due to insufficient funds to maintain it.
Long liquidations happen when an asset’s value drops unexpectedly, and traders with buy positions are forced to sell their contracts.
In comparison, on June 17, the value of short positions liquidated was less than $400,000.
Since this happened, DOGE’s funding rate across cryptocurrency exchanges has been predominantly negative. As of this writing, the meme coin’s weighted funding rate was -0.003%.
Read More: Dogecoin (DOGE) vs Shiba Inu (SHIB): What’s the Difference?

Funding rates refer to periodic payments made between traders to ensure the market price of a futures contract remains close to the underlying asset’s spot price.
When an asset’s futures price is higher than its spot price, the funding rate becomes positive, and traders with long positions pay a fee to traders with short positions. This suggests that there is more demand for long positions than short ones.
Conversely, an asset’s funding rate becomes negative when its perpetual futures price is lower than the spot price. In this situation, short traders pay a funding fee to those holding long positions.
When this happens, it suggests that more traders are buying the asset expecting its price to fall than those purchasing it in anticipation of a price rally.
DOGE Price Prediction: Long Traders To Face Rough Road Ahead
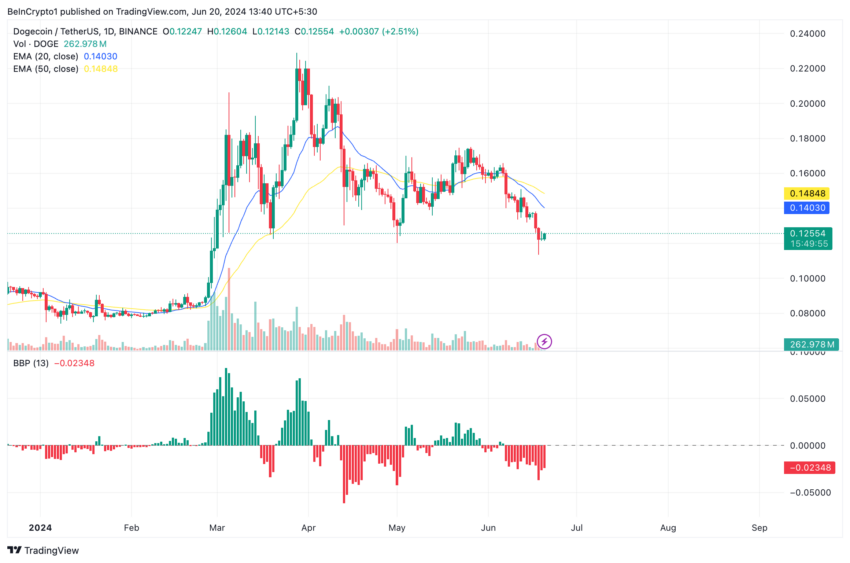
The decline in DOGE’s value caused its price to fall under the 20-day exponential moving average (EMA) and 50-day small moving average (SMA) on June 7.
An asset’s 20-day EMA measures its average price over the last 20 trading days, while its 50-day SMA tracks the average closing prices of an asset over the last 50 trading days.
When an asset’s price falls below these key moving averages, it signals a spike in selling pressure. It confirms the bearish bias toward the asset, and many traders interpret it as a sign to close their long positions.
The negative value of DOGE’s Elder-Ray Index confirms the bearish sentiment trailing the meme coin. Since the coin’s price fell below the key moving averages, as highlighted above, its Elder-Ray Index has returned only negative values.

This indicator measures the relationship between the strength of buyers and sellers in the market. When its value is negative, bear power dominates the market. As of this writing, the value of DOGE’s Elder-Ray Index is -0.023.
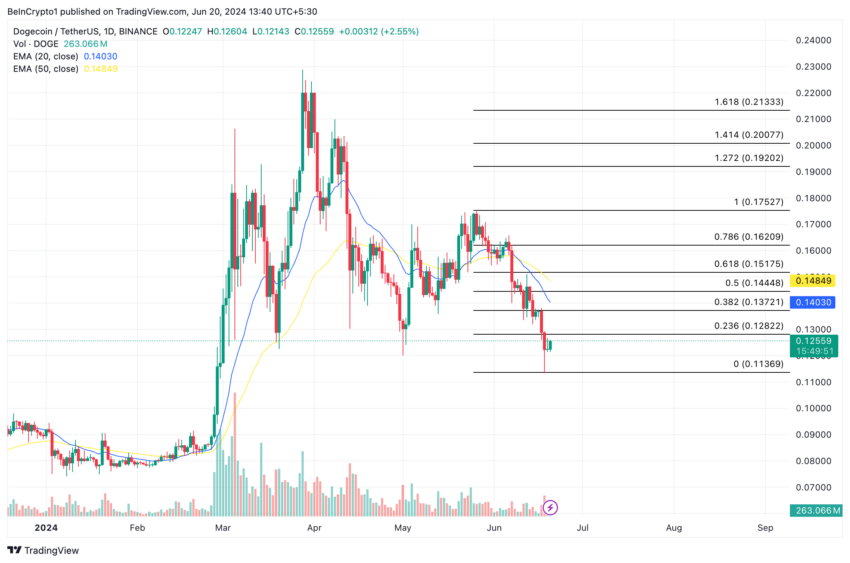
If DOGE bears continue to hold on to market control and selling momentum gains, the meme coin’s value may plummet to $0.11.
Read more: How to Buy Dogecoin (DOGE) With eToro: A Complete Guide

However, if the bias toward DOGE shifts to bullish and buying pressure skyrockets, the coin may rally toward $0.13.
The post Dogecoin (DOGE) Sees Spike in Demand for Short Positions appeared first on BeInCrypto.
